學校有一台 Fuji Xerox DocuPrint 305 雷射印表機,自己安裝驅動程式都安裝不起來,不好意思每次都要麻煩廠商,所以就花時間測試了一下,但疑問的是,在中文官方網站上下載的驅動程式,印表機可以安裝起來,但都不能列印。
中文官方網站網址:http://www.fujixerox.com.tw/downloads?product_id=41 [@more@]英文版的官方下載網站:http://www.fujixerox.co.jp/download/eng/docuprint/dp205series.html
後來在英文版的官方下載網站下載的就可以了!
用 XtraFinder 取代 Mac OSX 的 Finder
Mac OSX 中的 Finder 和 Windows 中的檔案總管的功能差不多,但缺少一些常用的功能,如分頁…等功能,雖然 Apple App Store 上有 TotalFinder 之類的程式可以補完這些功能,但 TotalFinder 是付費軟體,而 XtraFinder 是一套免費的軟體,剛好可以補這方式的不足。
原本的 Finder
XtraFinder 官方網站:http://www.trankynam.com/xtrafinder/
目前最新版本是 0.18.2
[@more@]
下載之後按二下掛載
按二下開始安裝
選擇 繼續
選擇 安裝
輸入密碼後,選擇 安裝軟體
安裝完成,選擇 關閉
上方列會出現 笑臉
把 分頁 功能打開
選擇 功能 設定項目
視情況勾選所須功能
完成的成果
關閉 Safari 下載之後自動解壓縮功能
Mac OSX 上的 Safari 瀏覽器在下載 zip 檔後,會自動解壓縮,有些人會覺得很方便,但我不是很習慣這樣的功能,還是希望能自己解壓縮。
選擇 Safari / 偏好設定
把前面的打勾取消
這樣就不會自動解壓縮了!
在 Mac OSX 上安裝香草輸入法
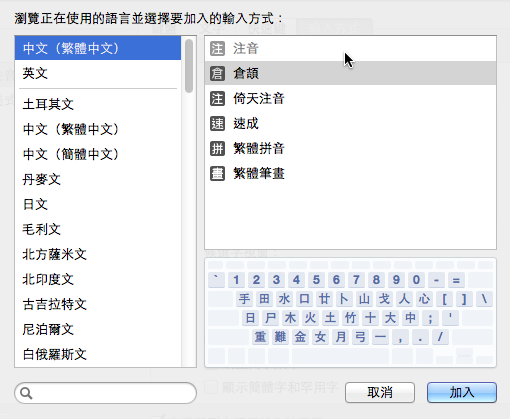
在 Mac OSX 上預設提供的中文輸入法中,並沒有提供 行列輸入法,所以要另外安裝香草輸入法
預設提供的中文輸入法
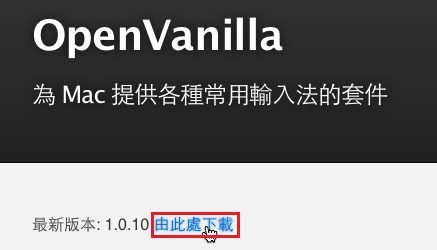
香草輸入法的官方網站: https://openvanilla.org/
香草輸入法的維基百科上的介紹: http://zh.wikipedia.org/wiki/OpenVanilla
[@more@]目前最新的版本是 1.0.10 版
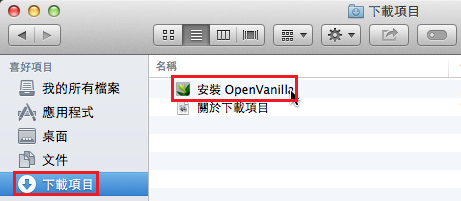
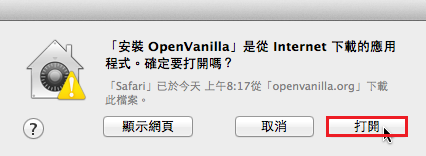
下載完成後,請到 下載項目中,選擇 安裝 OpenVanilla
選擇 打開
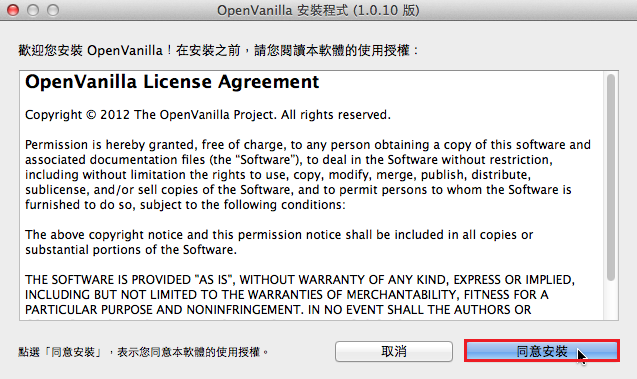
選擇 同意安裝
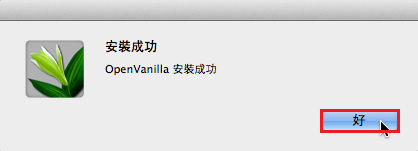
安裝完成,請選擇 好
在右上方按滑鼠左鍵

選擇安裝的 OpenVanilla
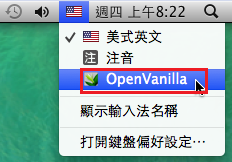
圖示會換成 OpenVanilla 的圖示

在 OpenVanilla 上按滑鼠右鍵,選擇 行列輸入法
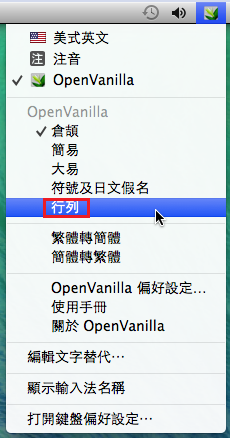
就可以開始使用了!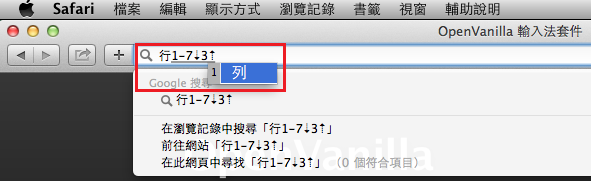
讓 Mac OSX 可以安裝第三方軟體套件
Mac OSX 了系統安全,預設是不能安裝第三方軟體套件,但有些軟體是在 Apple Store 上沒有提供,卻又是自己需要的,如 OpenVanilla(香草輸入法),所以在安裝這一類程式時,要先把這一項限制打開。
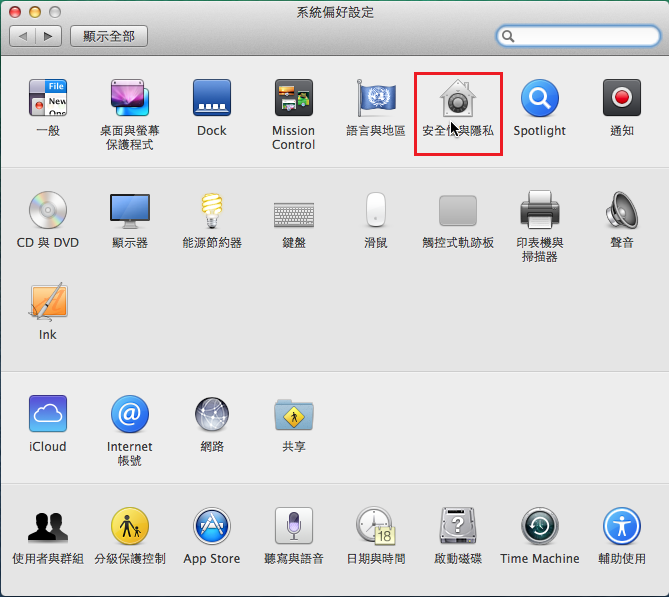
執行 Dock 上的 系統偏好設定

選擇 安全性與隱私
 [@more@]選擇左下角的 解鎖
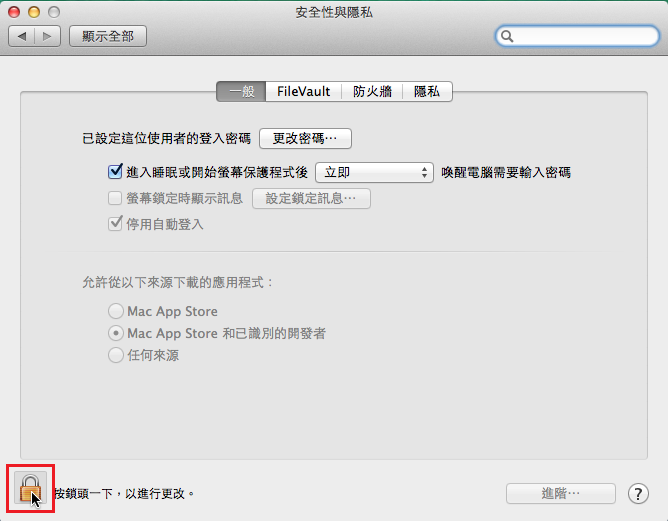
輸入使用者密碼,並按 解鎖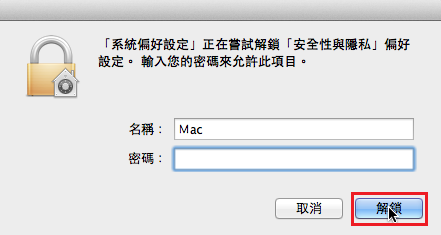
選擇 任何來源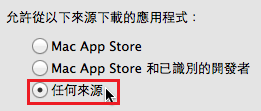
按一下 允許任何來源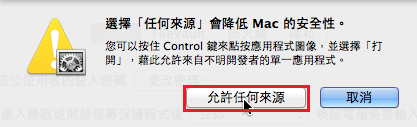
最後關設定視窗即可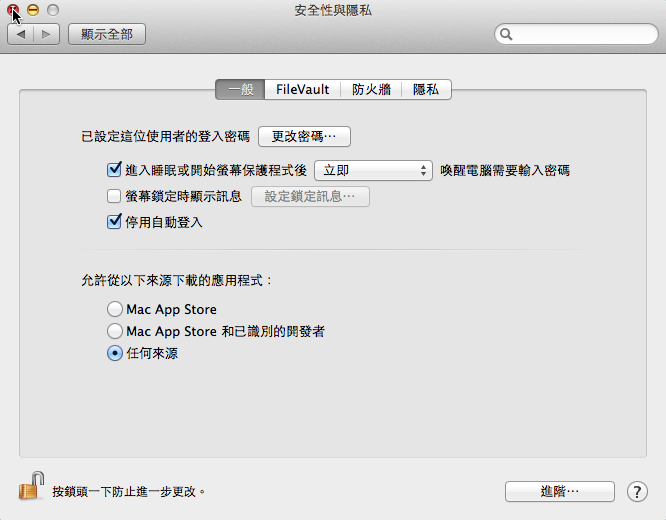
為了安全起見,可以安裝好套件後,再把來源改成 Mac App Store 和已識別的開發者
以 Nagios 偵測 MySQL Server
MySQL Server 為了安全,所以大部分都不建立連線埠,或者是僅限本機連線,不允許遠端連線,所以偵測 MySQL Server 就比較沒有那麼實際,而且在檢查時,密碼是以明碼傳送,會有安全性上的問題。
1. 檢查是否有 check_mysql 檢查指令
# locate check_mysql
/usr/lib64/nagios/plugins/check_mysql
/usr/lib64/nagios/plugins/check_mysql_query
2. 檢查一下,check_mysql 須要加入的參數
# /usr/lib64/nagios/plugins/check_mysql -h
Options:
-h, –help
Print detailed help screen
-V, –version
Print version information
–extra-opts=[section][@file]
Read options from an ini file. See http://nagiosplugins.org/extra-opts
for usage and examples.
-H, –hostname=ADDRESS
Host name, IP Address, or unix socket (must be an absolute path)
-P, –port=INTEGER
Port number (default: 3306)
-s, –socket=STRING
Use the specified socket (has no effect if -H is used)
-d, –database=STRING
Check database with indicated name
-u, –username=STRING
Connect using the indicated username
-p, –password=STRING
Use the indicated password to authenticate the connection
==> IMPORTANT: THIS FORM OF AUTHENTICATION IS NOT SECURE!!! <==
Your clear-text password could be visible as a process table entry
-S, –check-slave
Check if the slave thread is running properly.
-w, –warning
Exit with WARNING status if slave server is more than INTEGER seconds
behind master
-c, –critical
Exit with CRITICAL status if slave server is more then INTEGER seconds
behind master[@more@]3. 建立資料庫和資料庫使用者及密碼
# /usr/local/bin/mysqladmin -u root -p create nagiostest
# /usr/bin/mysql -u root -p -e “GRANT ALL PRIVILEGES ON nagiostest.* TO ‘ntest’@’localhost’ IDENTIFIED BY ‘123test’;”
4. 測試一下
# /usr/lib64/nagios/plugins/check_mysql -H 127.0.0.1 -P 3306 -u ntest -d nagiostest -p 123test
Uptime: 178009 Threads: 1 Questions: 348 Slow queries: 0 Opens: 16 Flush tables: 1 Open tables: 9 Queries per second avg: 0.1
5. 在 /etc/nagios/objects/commands.cfg 檔案加入
# ‘check_mysql’ command definition
define command{
command_name check_mysql
command_line $USER1$/check_mysql -H $ARG1$ -P $ARG2$ -u $ARG3$ -d $ARG4$ -p $ARG5$
}
6. 在要偵測的 MySQL Server 主機加入
# vim /etc/nagios/objects/localhost.cfg
define service{
use local-service ; Name of service template to use
host_name localhost
service_description MySQL
check_command check_mysql!127.0.0.1!3306!ntest!nagiostest!123test
notifications_enabled 1
}
重新啟動 Nagios
# service nagios restart
Running configuration check…done.
Stopping nagios: .done.
Starting nagios: done.
如果沒有出現錯誤訊息,代表設定成功
這時候應該可以看到下面的圖
以 Nagios 偵測 SNMP Service
1. 檢查是否有 check_snmp 檢查指令
一個是使用採用簡單認證,另外一個是支援加密傳輸
# locate check_snmp
/usr/lib64/nagios/plugins/check_snmp
2. 檢查一下,check_snmp 須要加入的參數
# /usr/lib64/nagios/plugins/check_snmp -h
-H, –hostname=ADDRESS
Host name, IP Address, or unix socket (must be an absolute path)
-p, –port=INTEGER
Port number (default: 161)
-n, –next
Use SNMP GETNEXT instead of SNMP GET
-P, –protocol=[1|2c|3]
SNMP protocol version
-L, –seclevel=[noAuthNoPriv|authNoPriv|authPriv]
SNMPv3 securityLevel
-a, –authproto=[MD5|SHA]
SNMPv3 auth proto
-x, –privproto=[DES|AES]
SNMPv3 priv proto (default DES)
-C, –community=STRING
Optional community string for SNMP communication (default is “public”)
-U, –secname=USERNAME
SNMPv3 username
-A, –authpassword=PASSWORD
SNMPv3 authentication password
-X, –privpasswd=PASSWORD
SNMPv3 privacy password
-o, –oid=OID(s)
Object identifier(s) or SNMP variables whose value you wish to query
[@more@]3. 測試一下
# /usr/lib64/nagios/plugins/check_snmp -H SNMP_Server’IP -o .1.3.6.1.2.1.1.3.0
SNMP OK – Timeticks: (41154894) 4 days, 18:19:08.94 |
4. 在 /etc/nagios/objects/commands.cfg 檔案加入
# ‘check_snmp’ command definition
define command{
command_name check_snmp
command_line $USER1$/check_snmp -H $HOSTADDRESS$ -o $ARG1$
}
5. 在要偵測的 SNMP 主機加入
# vim /etc/nagios/servers/snmp.cfg
define service{
use generic-service ; Name of service template to use
host_name snmp.test.ilc.edu.tw
service_description SNMP
check_command check_snmp!.1.3.6.1.2.1.1.3.0
notifications_enabled 1
}
重新啟動 Nagios
# service nagios restart
Running configuration check…done.
Stopping nagios: .done.
Starting nagios: done.
如果沒有出現錯誤訊息,代表設定成功
這時候應該可以看到下面的圖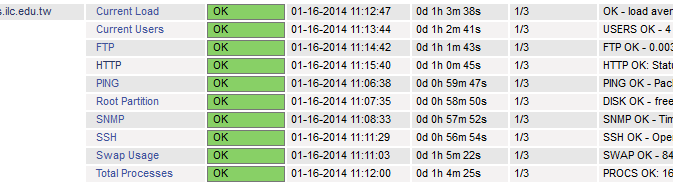
以 Nagios 偵測 LDAP Server
1. 檢查是否有 check_ldap 檢查指令
一個是使用採用簡單認證,另外一個是支援加密傳輸
# locate check_ldap
/usr/lib64/nagios/plugins/check_ldap
/usr/lib64/nagios/plugins/check_ldaps
2. 檢查一下,check_ldap 須要加入的參數
# /usr/lib64/nagios/plugins/check_ldap -h
Options:
-h, –help
Print detailed help screen
-V, –version
Print version information
–extra-opts=[section][@file]
Read options from an ini file. See http://nagiosplugins.org/extra-opts
for usage and examples.
-H, –hostname=ADDRESS
Host name, IP Address, or unix socket (must be an absolute path)
-p, –port=INTEGER
Port number (default: 389)
-4, –use-ipv4
Use IPv4 connection
-6, –use-ipv6
Use IPv6 connection
-a [–attr]
ldap attribute to search (default: “(objectclass=*)”
-b [–base]
ldap base (eg. ou=my unit, o=my org, c=at
-D [–bind]
ldap bind DN (if required)
-P [–pass]
ldap password (if required)
-T [–starttls]
use starttls mechanism introduced in protocol version 3
-S [–ssl]
use ldaps (ldap v2 ssl method). this also sets the default port to 636
-2 [–ver2]
use ldap protocol version 2
-3 [–ver3]
use ldap protocol version 3
(default protocol version: 2)
-w, –warning=DOUBLE
Response time to result in warning status (seconds)
-c, –critical=DOUBLE
Response time to result in critical status (seconds)
-t, –timeout=INTEGER
Seconds before connection times out (default: 10)
-v, –verbose
Show details for command-line debugging (Nagios may truncate output)
[@more@]3. 測試一下
# /usr/lib64/nagios/plugins/check_ldap -H ldap.test.ilc.edu.tw -b dc=ldap,dc=test.ilc.edu.tw -p 389
LDAP OK – 0.026 seconds response time|time=0.026050s;;;0.000000
4. 在 /etc/nagios/objects/commands.cfg 檔案加入
# ‘check_ldap’ command definition
define command{
command_name check_ldap
command_line $USER1$/check_ldap -H $HOSTADDRESS$ -b $ARG1$ -p $ARG2$
}
5. 在要偵測的 DNS 主機加入
# vim /etc/nagios/servers/ldap.cfg
define service{
use generic-service ; Name of service template to use
host_name ldap.test.ilc.edu.tw
service_description LDAP
check_command check_ldap!dc=ldap,dc=test.ilc.edu.tw!389
notifications_enabled 1
}
重新啟動 Nagios
# service nagios restart
Running configuration check…done.
Stopping nagios: .done.
Starting nagios: done.
如果沒有出現錯誤訊息,代表設定成功
這時候應該可以看到下面的圖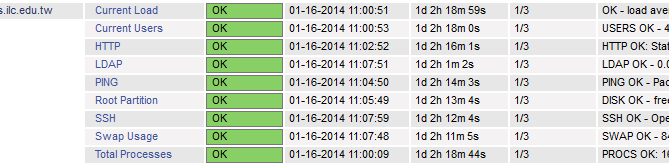
以 Nagios 偵測 DNS Server
1. 檢查是否有 check_dns 檢查指令
# locate check_dns
/usr/lib64/nagios/plugins/check_dns
2. 檢查一下,check_dns 須要加入的參數
# /usr/lib64/nagios/plugins/check_dns -h
Options:
-h, –help
Print detailed help screen
-V, –version
Print version information
–extra-opts=[section][@file]
Read options from an ini file. See http://nagiosplugins.org/extra-opts
for usage and examples.
-H, –hostname=HOST
The name or address you want to query
-s, –server=HOST
Optional DNS server you want to use for the lookup
-a, –expected-address=IP-ADDRESS|HOST
Optional IP-ADDRESS you expect the DNS server to return. HOST must end with
a dot (.). This option can be repeated multiple times (Returns OK if any
value match). If multiple addresses are returned at once, you have to match
the whole string of addresses separated with commas (sorted alphabetically).
-A, –expect-authority
Optionally expect the DNS server to be authoritative for the lookup
-w, –warning=seconds
Return warning if elapsed time exceeds value. Default off
-c, –critical=seconds
Return critical if elapsed time exceeds value. Default off
-t, –timeout=INTEGER
Seconds before connection times out (default: 10)[@more@]3. 測試一下
# /usr/lib64/nagios/plugins/check_dns -H www.ilc.edu.tw -s DNS’IP
DNS OK: 0.012 seconds response time. www.ilc.edu.tw returns 140.111.66.96|time=0.012217s;;;0.000000
4. 在 /etc/nagios/objects/commands.cfg 檔案加入
# ‘check_dns’ command definition
define command{
command_name check_dns
command_line $USER1$/check_dns -H $ARG1$ -s $HOSTADDRESS$
}
5. 在要偵測的 DNS 主機加入 dns.test.ilc.edu.tw 就是要偵測的 DNS 主機
# vim /etc/nagios/servers/dns.cfg
define service{
use generic-service ; Name of service template to use
host_name dns.test.ilc.edu.tw
service_description DNS
check_command check_dns!www.ilc.edu.tw
notifications_enabled 1
}
重新啟動 Nagios
# service nagios restart
Running configuration check…done.
Stopping nagios: .done.
Starting nagios: done.
如果沒有出現錯誤訊息,代表設定成功
這時候應該可以看到下面的圖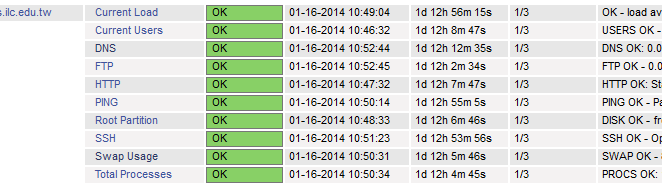
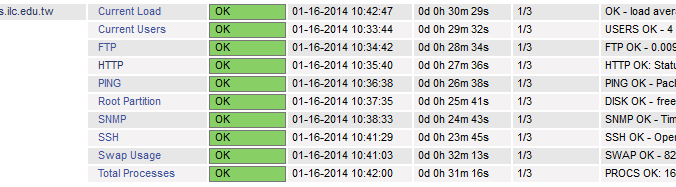
解決 Nagios 偵測主機服務狀態出現的提示圖
使用 Nagios 偵測主機服務狀態時,在 OK 的前面會出現一個提示圖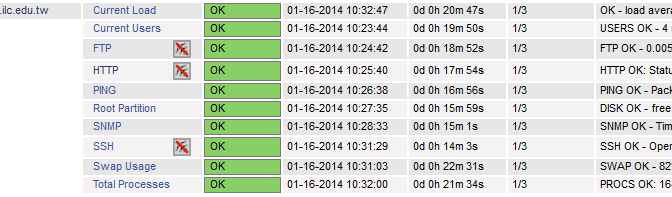
以 HTTP 服務,點選圖之後會出現的畫面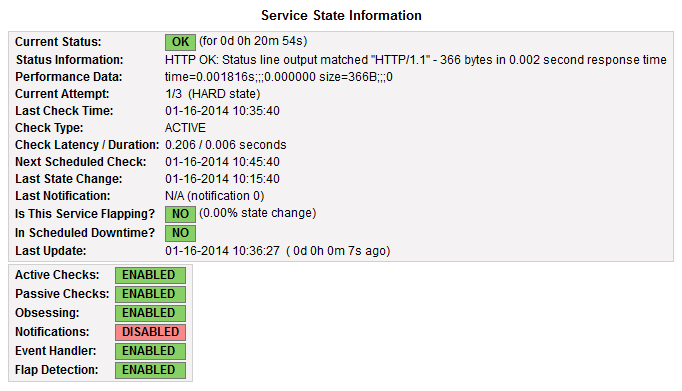
看起來似乎是沒有設定當服務出現問題時,是否要發出提示或警告的訊息,但服務還是有正常啟動,如果很在意出現這個圖的話,底下是解決的方式:[@more@]修改原有的偵測主機設定檔
把
notifications_enabled 0
都改成
notifications_enabled 1
# vim /etc/nagios/servers/www.cfg
define host {
use linux-server
host_name www.test.ilc.edu.tw
alias www.test.ilc.edu.tw
address 192.168.1.1
}
define service{
use generic-service ; Name of service template to use
host_name www.test.ilc.edu.tw
service_description SSH
check_command check_ssh
notifications_enabled 1
}
define service{
use generic-service ; Name of service template to use
host_name www.test.ilc.edu.tw
service_description HTTP
check_command check_http
notifications_enabled 1
}
define service{
use generic-service ; Name of service template to use
host_name www.test.ilc.edu.tw
service_description FTP
check_command check_ftp
notifications_enabled 1
}
重新啟動 Nagios
# service nagios restart
Running configuration check…done.
Stopping nagios: .done.
Starting nagios: done.
這時就不會再出現了!